

Business Intelligence 
BI(Business Intelligence) is a set of processes, architectures, and technologies that convert raw data into meaningful information that drives profitable business action .It is a suite of software and services to transform data into actionable intelligence and knowledge. BI is made up of:
- Data mining.
- Analytical processing.
- Querying and reporting.
The major purpose that Business Intelligence serves for a business is helping the corporate executives, business managers, and other operational heads take better data-driven business decisions. Many companies are using BI for cost-cutting, identifying better business opportunities, and spotting inefficient business processes.
Our team of BI experts offers a wide range of methods to help your company by transforming raw data into information in a context that helps end-users utilize that information to make better, informed decisions. Here are ways, our of BI experts can enhance your organization and help decision makers make more informed, effective choices by use Business Intelligence.
In a market saturated with apps, social media platforms, analytics tools, and pay-per-click campaigns, we can help small businesses figure out if the marketing strategy they've invested in is producing ROI (return on investment). We can help you create analytics reports where businesses can base decisions on solid research, data, and facts, rather than intuition, assumption, or gut instinct. How do you know something is working? Reports can tell you a much bigger story than you could imagine.
Business intelligence today is more important than ever. Ninety percent of the data that exists today the world over was created in the last two years alone. Going forward, the rate of data creation is only going to accelerate. The chief reason for that is the explosion of social media channels and the burgeoning number of users disseminating data at breakneck speeds. What's the point of all that sea of data without an iota of insightful information? Businesses are finding it a conundrum to decipher meaningful insights out of it all. This is where business intelligence can chip in and we can help your company do it. It is the art of deriving knowledge from all the business processes to help enterprises gain a head start to better understand customer needs and market dynamics. Improving performance, delivering on customer promises, and building long-term customer relationships are some of the benefits of BI which we will offer to companies.
To know who your end user is, what influences their decisions, and how they consume their information. In today’s marketplace, there are thousands of outlets pushing information, and not everyone can consume everything. By use Business intelligence, our BI experts will help your company know where and how (media outlets and through articles, videos, ads, podcast, etc.) your ideal customer consumes their information, what is going to drive them to purchase and subscribe, and executing a plan to take advantage of that knowledge.
Business intelligence is critical to both executives and owners equally as it provides insights into the true health of an organization that is not readily available from a profit and loss statement. There are a plethora of BI applications available on the market today that integrate with your accounting software. The key is to understand which is best for your type of business as each has its own pros/cons and features. Business intelligence is not just about tracking KPIs (key performance indicators) once a month or quarter. BI includes forecasting to avoid bottlenecks and provide perfect timing for decision making such as purchasing or new hires. An easy-to-read dashboard that is reviewed weekly will help you be more informed and avoid problems in a very fragile market. We will assist our clients find the best fit-for-their purpose BI applications.
The internet and the continued growth of e-commerce have saturated every market. You want clothing, furniture, even food? There are dozens of options around the block or just a click away. For business owners, this means making smart decisions and trying to know where to put your marketing dollars and where to invest in infrastructure. We can help you do that by using the feature of BI.
Business intelligence is having access to all your business data, regardless of platform, in a singular, unified dashboard. This can include customer data from your CRM system, email marketing, and website engagements tracked in your data management platform, customer interactions on user chat tools like Intercom.io — all aggregated into a single holistic view of the customer and their interactions with your business.
This is extremely important now as customers are interacting with a business across a multitude of platforms and channels, including their website, social channels, live chat tools, email, and also purchasing products both offline and online. Without a single consolidated view of the customer, it would be difficult to know how to best address them, or meet their needs. But with the BI, we can help you do it easier.
Business intelligence or analytics has become critical in retail given the fast pace at which consumers expect orders to be delivered to their doorsteps (the Amazon effect). Retailers and brands need to know where their inventory is located and how well it’s selling. Analytics provides this insight to buyers and executives so they can capitalize on buying trends.
To truly understand and satisfy customers’ needs and correct problems, companies must first understand why a phenomenon is happening, rather than go with a gut feeling. By using BI, we will help our clients adding qualitative analytics to their dashboard alongside the quantitative data that can give them that big picture which can answer all questions involved consumer behavior and propose fit solutions.
We use these tools to give our clients the insights they need to achieve things like growth, resolve issues that are urgent, collect all their data in one place, forecast future outcomes and so much more.
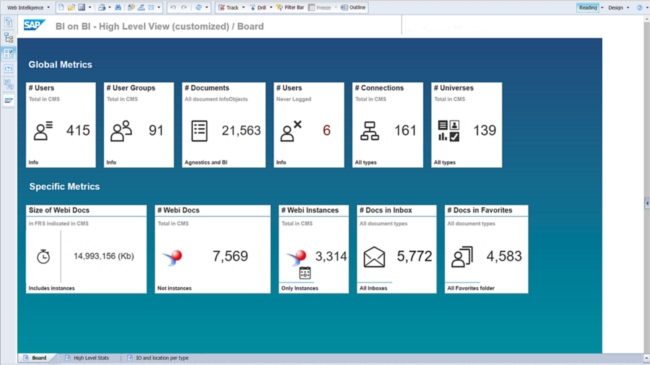
SAP Business Intelligence
SAP Business Intelligence offers several advanced analytics solutions including real-time BI predictive analytics, machine learning, and planning & analysis. The Business Intelligence platform in particular, offers reporting & analysis, data visualisation & analytics applications, office integration and mobile analytics. SAP is a robust software intended for all roles (IT, end uses and management) and offers tons of functionalities in one platform.
Website : www.sap.com
Figure 1:
SAP Business Intelligence
MicroStrategy
MicroStrategy is a business intelligence tool that offers powerful (and high speed) dashboarding and data analytics which help monitor trend, recognise new opportunities, improve productivity and more. Users can connect to one or various sources, whether the incoming data is from a spreadsheet, cloud-based or enterprise data software. It can be accessed from your desktop or via mobile.
Website : www.microstrategy.com
Figure 2:
MicroStrategy
Datapine
Datapine is an all-in-one BI platform that facilitates the complex process of data analytics even for non-technical users. Thanks to a comprehensive self-service analytics approach, datapine’s solution enables data analysts and business users alike to easily integrate different data sources, perform advanced data analysis, build interactive business dashboards and generate actionable business insights.
Website : www.datapine.com
Figure 3:
Datapine
Yellowfin BI
Yellowfin BI is a business intelligence tool and ‘end-to-end’ analytics platform that combines visualisation, machine learning, and collaboration. You can also easily filter through tons of data with intuitive filtering (e.g. checkboxes and radio buttons) as well open up dashboards just about anywhere (thanks to this tool’s flexibility in accessibility (mobile, webpage, etc.).
Website : www.yellowfinbi.com
Figure 4:
Yellowfin
QlikSense
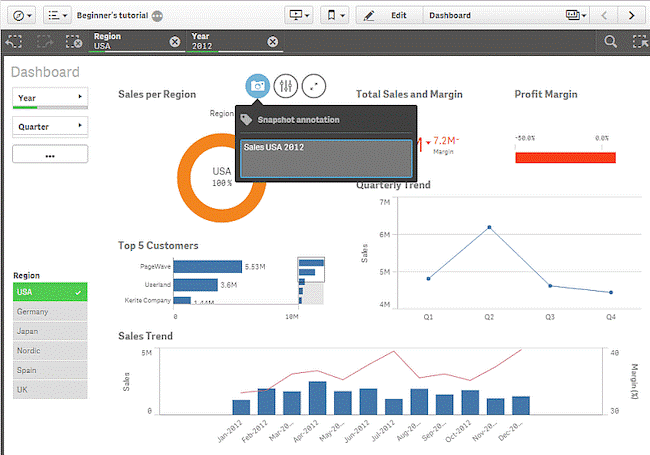
QlikSense is a product of Qlik, a company also known for another business intelligence tool called QlikView. You can use QlikSense from any device at any time. The user interface of QlikSense is optimized for touchscreen, which makes it a very popular bi tool. A big difference with QlikView is the feature Storytelling. Users add their experience to the data and by using snapshots and highlights making the right analysis and decisions has become a lot easier
Website : www.qlik.com
Figure 5:
QlikSense
Zoho Analytics
Use Zoho Analytics for in depth reporting and data analysis. This business intelligence tool has automatic data sync and can be scheduled periodically. You can easily build a connector by using the integration API’s. Blend and merge data from different sources and create meaningful reports. With an easy editor you create personalized reports and dashboards enabling you to zoom into the important details.
Website : www.zoho.com/analytics
Figure 6:
oho Analytics
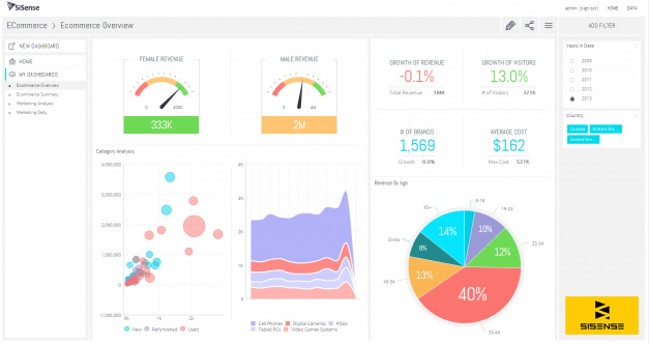
Sisense
Not really tech-savvy? Then the Sisense business intelligence tool might be for you. This user-friendly tool allows anyone within your organisation to manage large and complex datasets as well as analyse and visualise this data without your IT department getting involved. It lets you bring together data from a wide variety of sources as well including Adwords, Google Analytics and Salesforce. Not to mention, because it uses in-chip technology, data is processed quite quickly compared to other tools.
Website : www.sisense.com
Figure 7:
Sisense
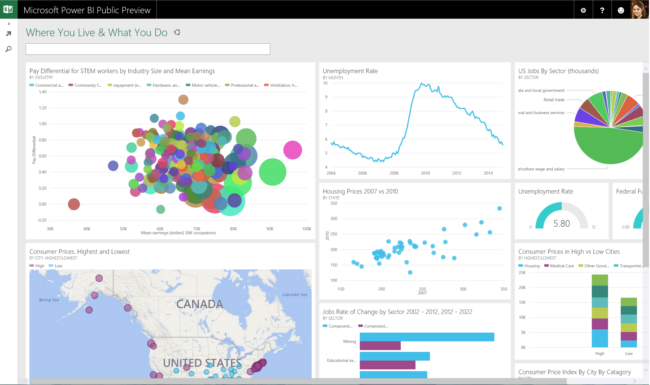
Microsoft Power BI
Microsoft Power BI is a web-based business analytics tool suite which excels in data visualisation. It allows users to identify trends in real-time and has brand new connectors that allow you to up your game in campaigns. Because it’s web-based, Microsoft Power BI can be accessed from pretty much anywhere. This software also allows users to integrate their apps and deliver reports and real-time dashboards.
Website : www.powerbi.microsoft.com
Figure 8:
Microsoft Power BI
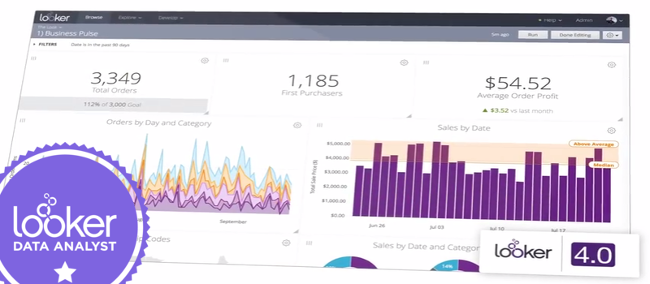
Looker
Data discovery app, Looker is another BI tool to look out for! This platform integrates with any SQL database or warehouse and is great for startups, midsize-businesses or enterprise-grade businesses. Some benefits of this particular tool include ease-of-use, handy visualisations, powerful collaboration features (data and reports can be shared via email or USL as well as integrated with other applications), and reliable support (tech team).
Website : www.looker.com
Figure 9:
Looker
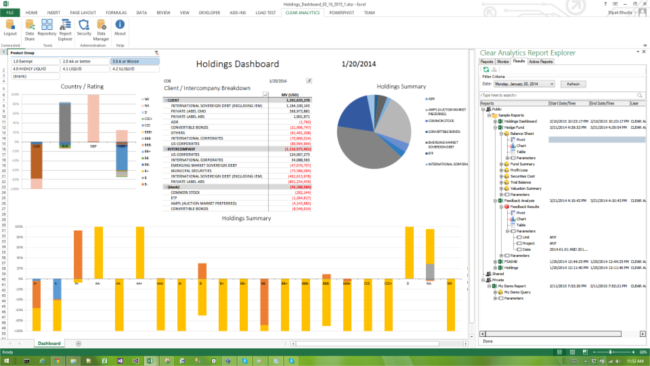
Clear Analytics
Where are all my Excel fans out there? This BI tool is an intuitive Excel-based software that can be used by employees with even the most basic knowledge of Excel. What you get is a self-service Business Intelligence system that offers several BI features such as creating, automating, analysing and visualisation your company’s data.
Website : www.clearanalyticsbi.com
Figure 10:
Clear Analytics
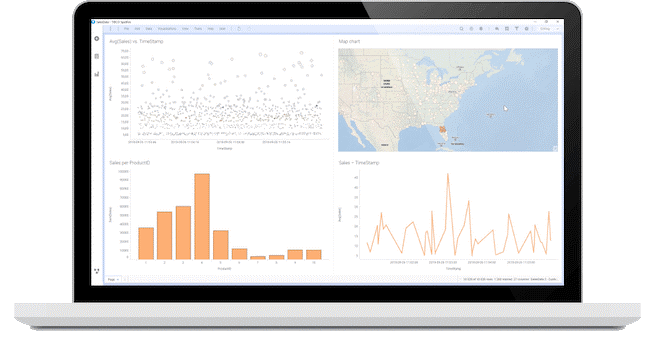
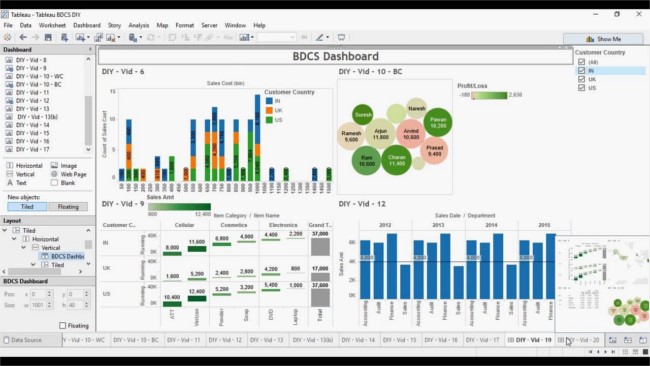
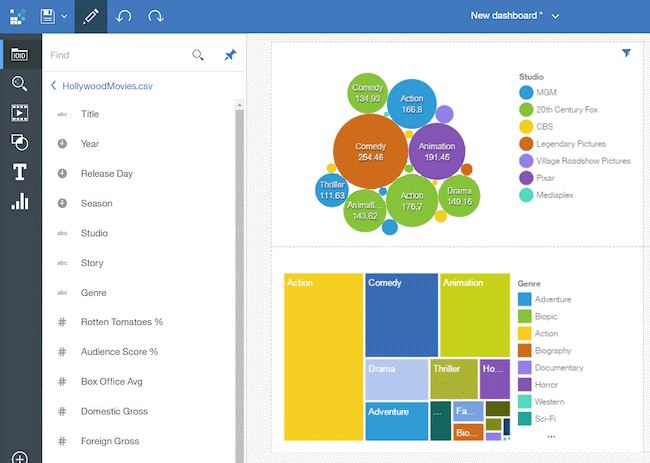
Tableau
Tableau is a Business Intelligence software for data discovery and data visualisation. With the software you can easily analyse, visualise and share data, without IT having to intervene. Tableau supports multiple data sources such as MS Excel, Oracle, MS SQL, Google Analytics and SalesForce. Tableau is free for personal use. However, if you want more, the price can go up quickly. But of course, this will give you something in return: well-designed dashboards that are very easy to use. Additionally Tableau also offers three standalone products: Tableau Desktop (for anyone) and Tableau Server (analytics for organisations), which can be run locally and Tableau Online (hosted analytics for organisations).
Website : www.tableau.com
Figure 11:
Tableau
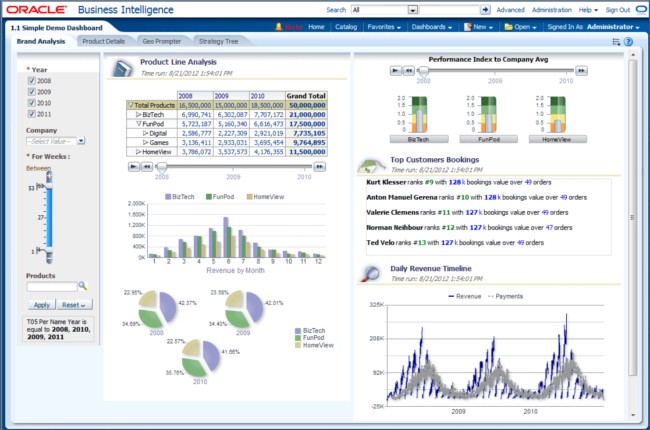
Oracle BI
Oracle BI is an enterprise portfolio of technology and applications for business intelligence. This technology gives users pretty much all BI capabilities, such as dashboards, proactive intelligence, alerts, ad hoc, and more. Oracle is also great for companies who need to analyse large data volumes (from Oracle and non-Oracle sources) as it is a very robust solution.
Website : www.oracle.com
Figure 12:
Oracle BI
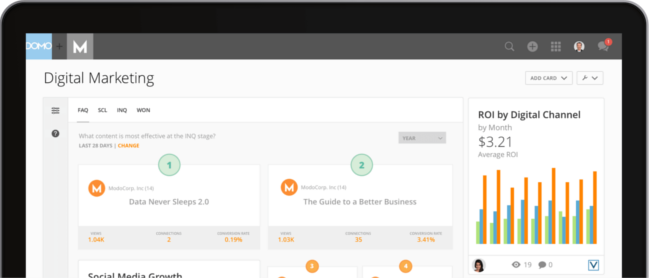
Domo
Domo is a completely cloud-based business intelligence platform that integrates multiple data sources, including spreadsheets, databases and social media. Domo is used by both small companies and large multinationals. The platform offers micro and macro level visibility and analyses. From cash balances and listings of your best selling products by region to calculations of the marketing return on investment (ROI) for each channel. The only let down about Domo is that it is difficult to download analyses from the cloud for personal use.
Website : www.domo.com
Figure 13:
Domo
IBM Cognos Analytics
Cognos Analytics is an AI-fueled business intelligence platform that supports the entire analytics cycle. From discovery to operationalization.You can visualize, analyze and share actionable insights about your data with your colleagues. A great benefit of AI is that you are able to discover hidden patterns, because the data is being interpreted and presented to you in a visualized report.
Website : www.ibm.com
Figure 14:
IBM Cognos Analytics
Thank you! Your information has been well-received. Our support team will contact you within 1 hour !

Contact Us!
Our support team usually responds in 12 hours or less.